
I recently spent a couple of hours annotating the IB Physics data booklet. Can you believe it was my first time doing it properly? Let me tell you, it is a game-changer.
If you are gearing up for your IB Physics exams, this is a must-do.
Annotating the data booklet is one of the most valuable revision tasks you can do. Not because it looks neat, but because it works. When you add your own notes, diagrams, and reminders, you are forcing yourself to engage deeply with the material. You are not just memorising formulas; you are connecting them to concepts, visualising their applications, and building the kind of understanding that holds up under exam pressure.
The data booklet is already packed with information, but there are gaps. Those gaps can be the difference between a 5 and a 7. Filling them in with missing formulas, key constants, and visual aids gives you a personalised study tool that actually reflects how you think.
If you annotate your data booklet properly, you can cover the majority of the IB Physics syllabus in a couple of hours.
And if you do not have a couple of hours to spare, the GradePod Exam Pack includes my fully annotated version ready to use.
Here are my six tips on exactly how to do it.
Tip 1: Add Diagrams to Aid Memory
When you see a formula, it is easy to get lost in the symbols and forget what it actually represents. Add a quick sketch alongside it and it clicks immediately. A force diagram, a circuit layout, a graph showing the inverse square law; these connect theory to reality in a way that abstract symbols cannot.
Diagrams also trigger visual recall. If you are stuck on an electric fields problem, a diagram showing field lines with a note about how field strength decreases with distance will pop into your mind and guide you to the right approach. The same goes for mechanics: seeing a diagram of forces on a rigid body reminds you which formulas apply and how to use them.
When you start thinking visually about physics, you start getting better marks in exams.
Mathematical equations
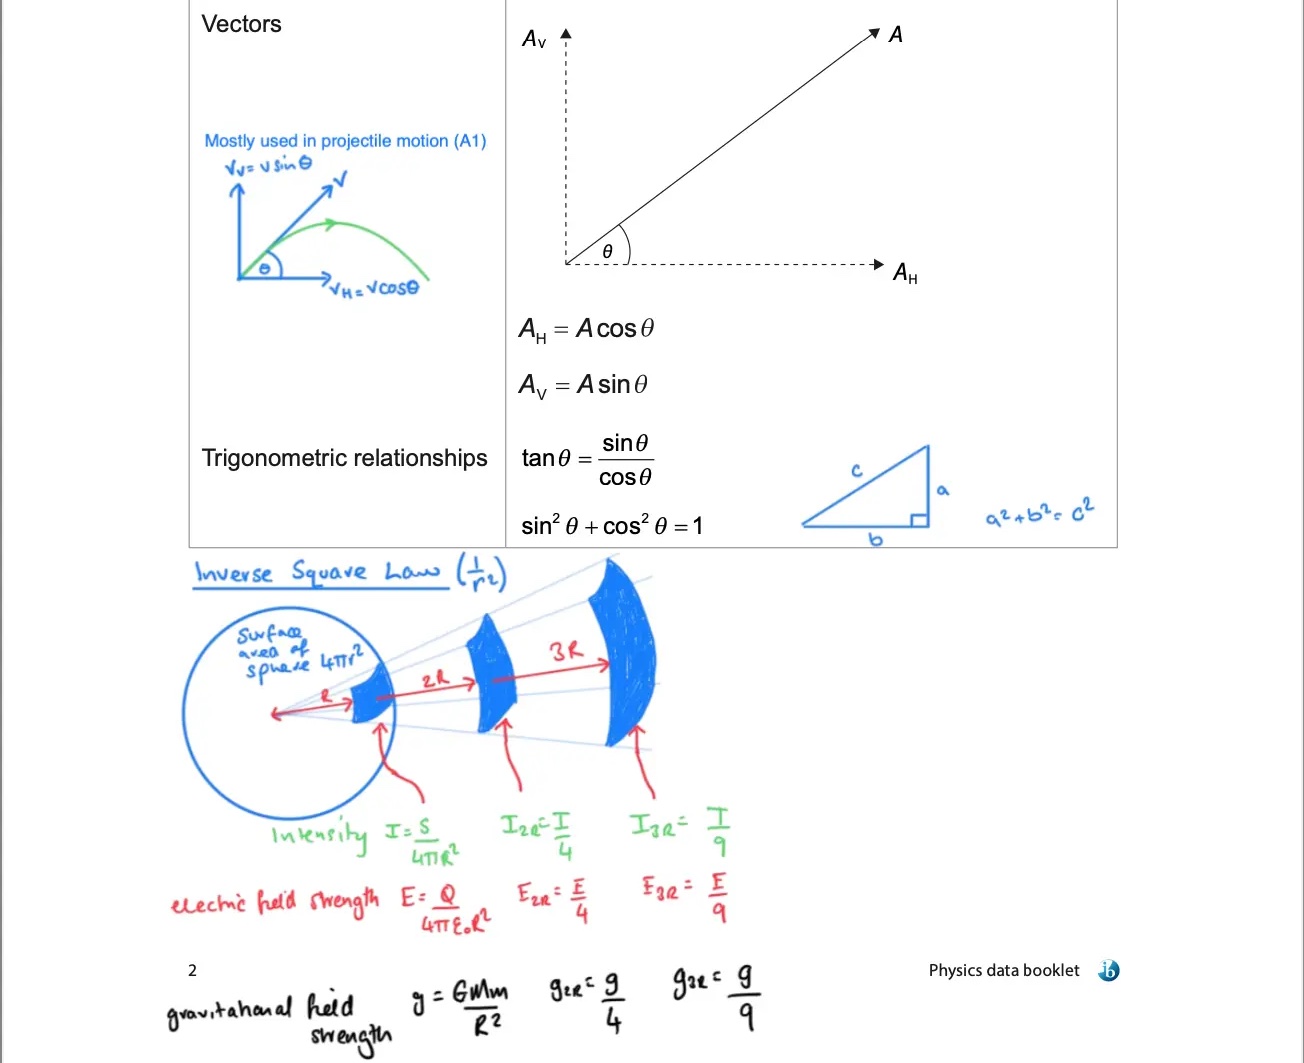
The inverse square law appears throughout the data booklet in different contexts (intensity, electric field strength, gravitational field strength). Drawing one clear diagram and linking it to all three is enormously useful.
Doppler Effect
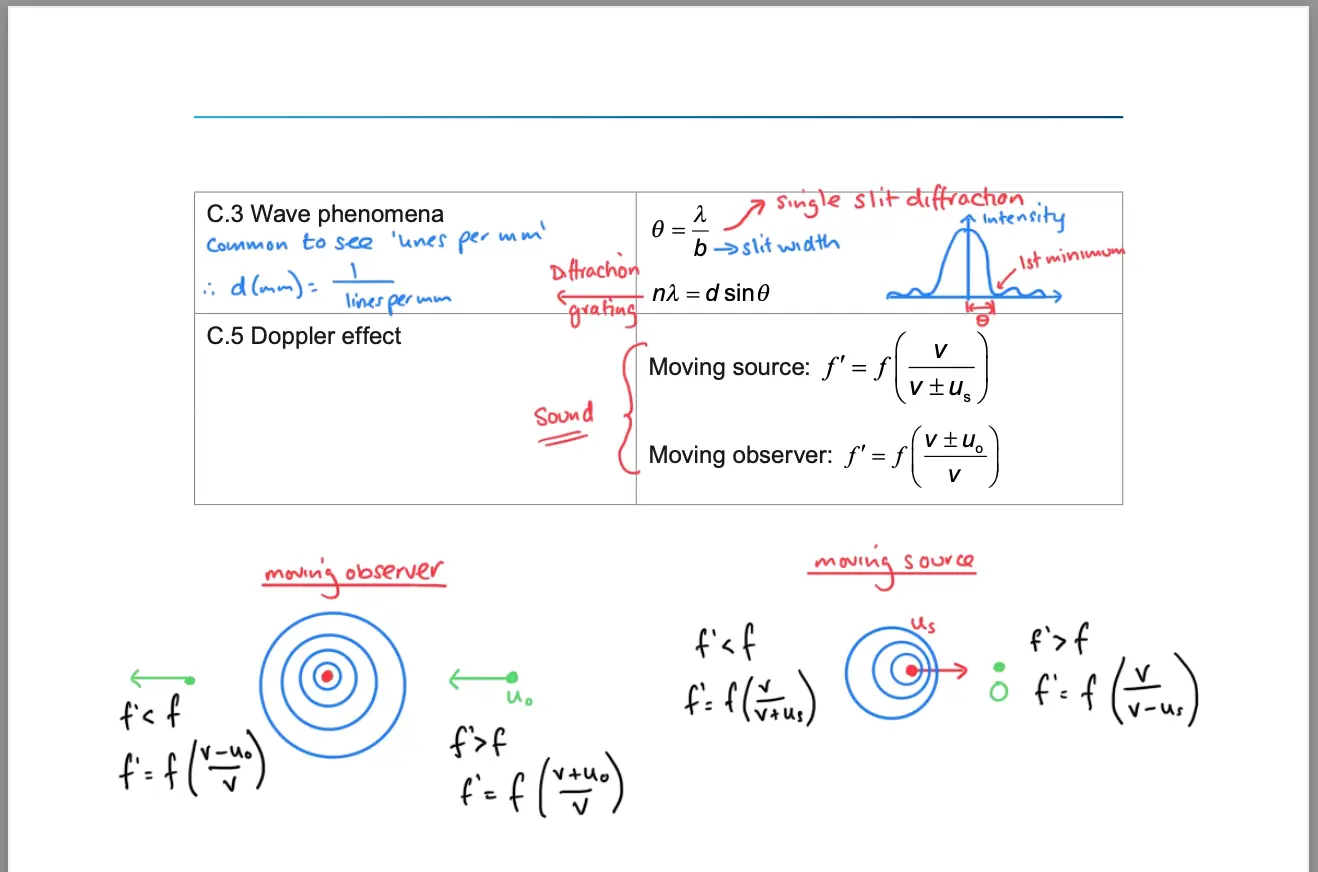
If you are Higher Level, the Doppler equations can be tricky to keep straight. A diagram showing source and observer motion bridges the gap between the formula and what is actually happening physically.
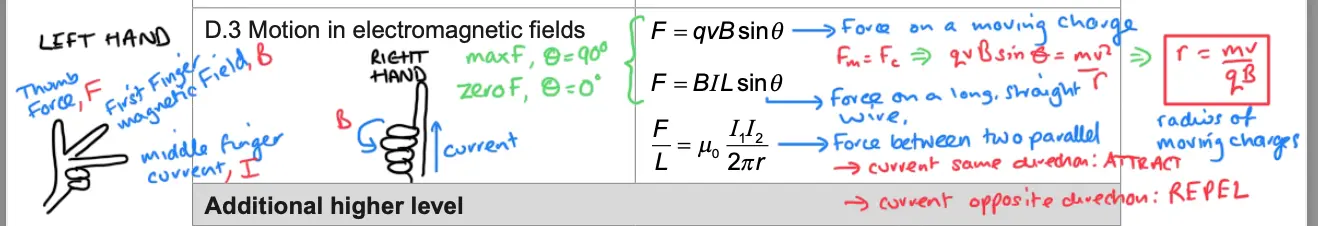
Fields
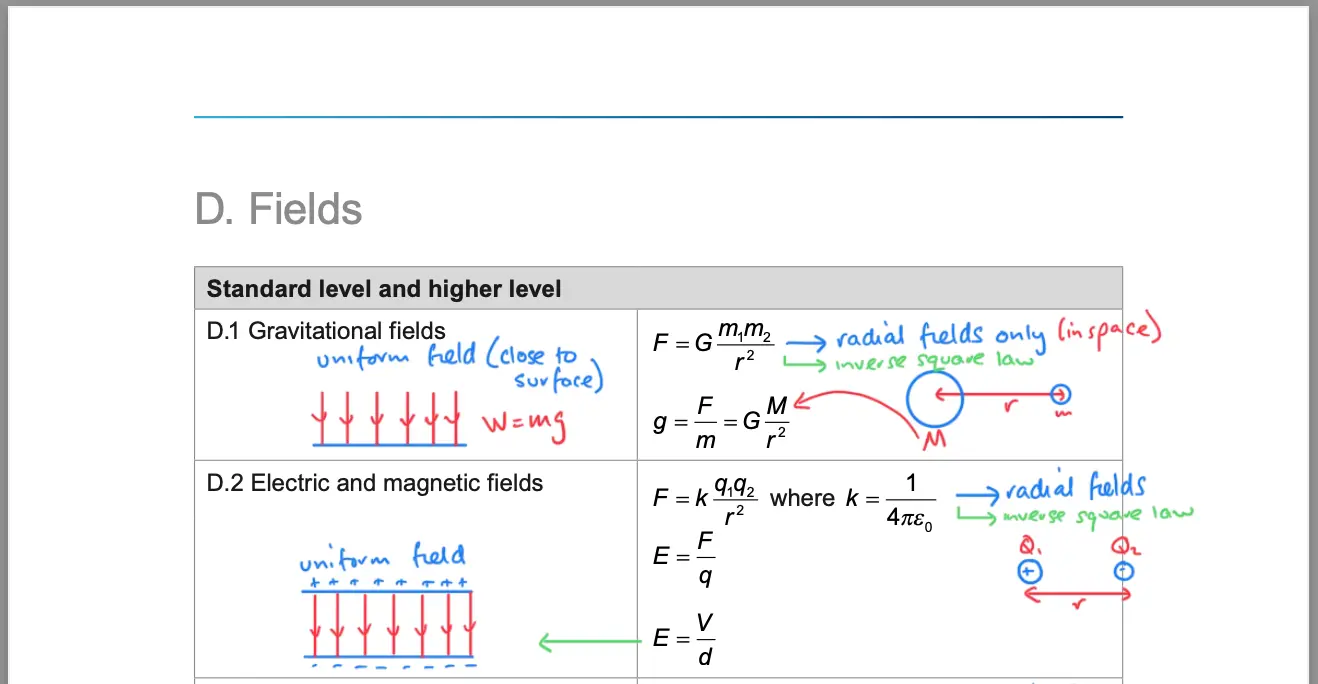
Whether it is the equation for electric field strength or Fleming’s left-hand rule, diagrams make complex ideas much easier to recall when you are under pressure.
Tip 2: Add Missing Formulas
Some formulas are not in the data booklet but come up in exams. The formula for the radius of a charged particle moving in a magnetic field is a good example; knowing it can earn you easy marks.
If you are not sure which formulas to add, read the IB Physics formulas to memorise post, which covers everything the IB expects you to know that does not appear in the booklet.
Tip 3: Highlight Key Constants
These are in the booklet, but knowing them by heart saves precious time in the exam.
- Acceleration of free fall: g = 9.8 m s⁻² (use 10 for Paper 1A multiple choice)
- Gravitational constant: G = 6.67 × 10⁻¹¹ N m² kg⁻²
- Coulomb constant: k = 8.99 × 10⁹ N m² C⁻²
- Speed of light: c = 3 × 10⁸ m s⁻¹
- Elementary charge: remember it as 1 eV = 1.6 × 10⁻¹⁹ J
Tip 4: Annotate Graphs (The Most Important Tip)
Annotated graphs are critical. They show relationships. You can add a graph to almost every section of the data booklet, and when you do, you are not just visualising the concept; you are breaking down what each part of the graph means.
Mark what the gradient represents. Highlight the area under a curve (like the area under a force-time graph, which equals impulse). Note turning points and what they signify, such as in SHM energy graphs where potential and kinetic energy swap roles. For exponential relationships, try adding the linearised version alongside it.
When you walk into your exam having already annotated all of these, interpreting graphs becomes second nature.
Circuit symbols
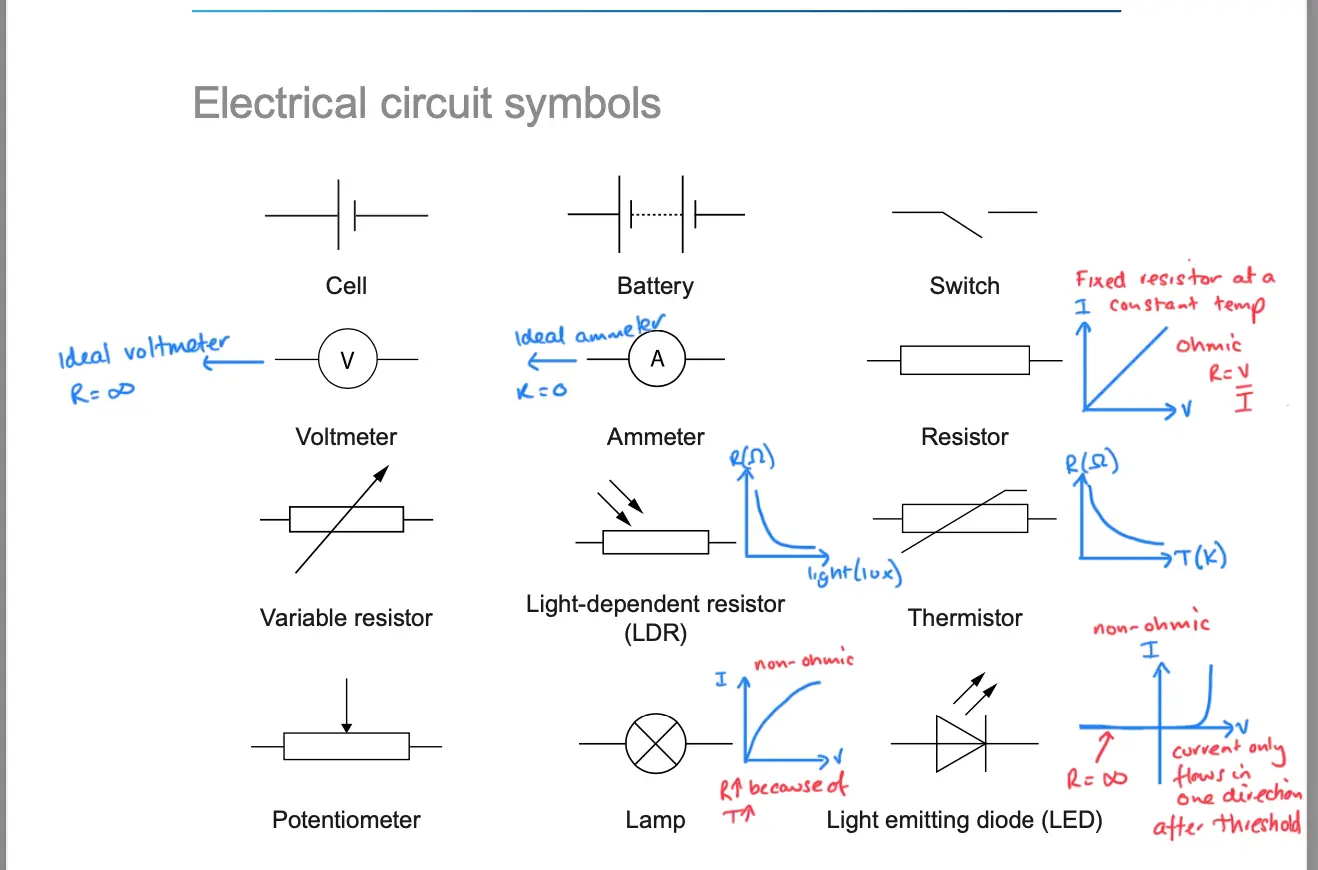
Add the IV characteristic graphs beside the symbols for fixed resistors, thermistors, light-dependent resistors, and LEDs. It takes two minutes and covers a lot of potential exam questions.
Impulse
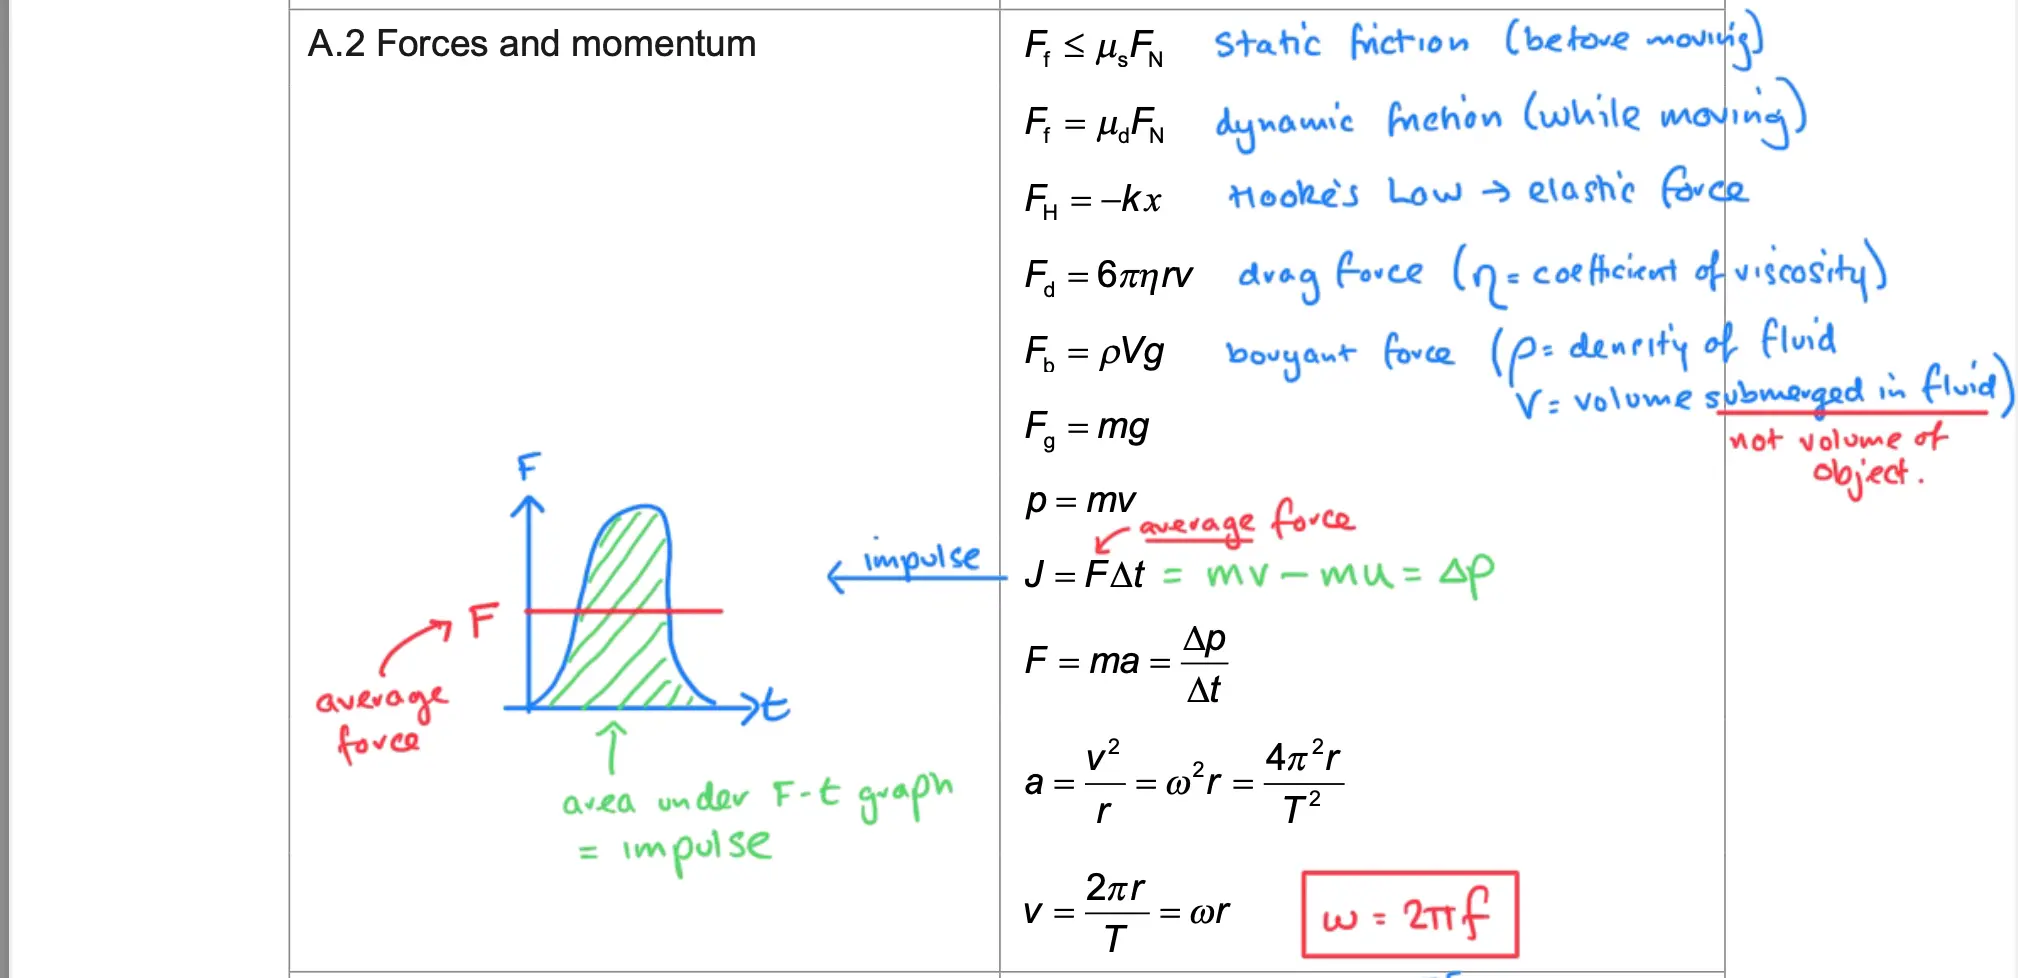
The area under a force-time graph equals impulse. This is worth adding explicitly next to the J = FΔt equation, since the booklet does not make the graphical connection obvious.
Special Relativity
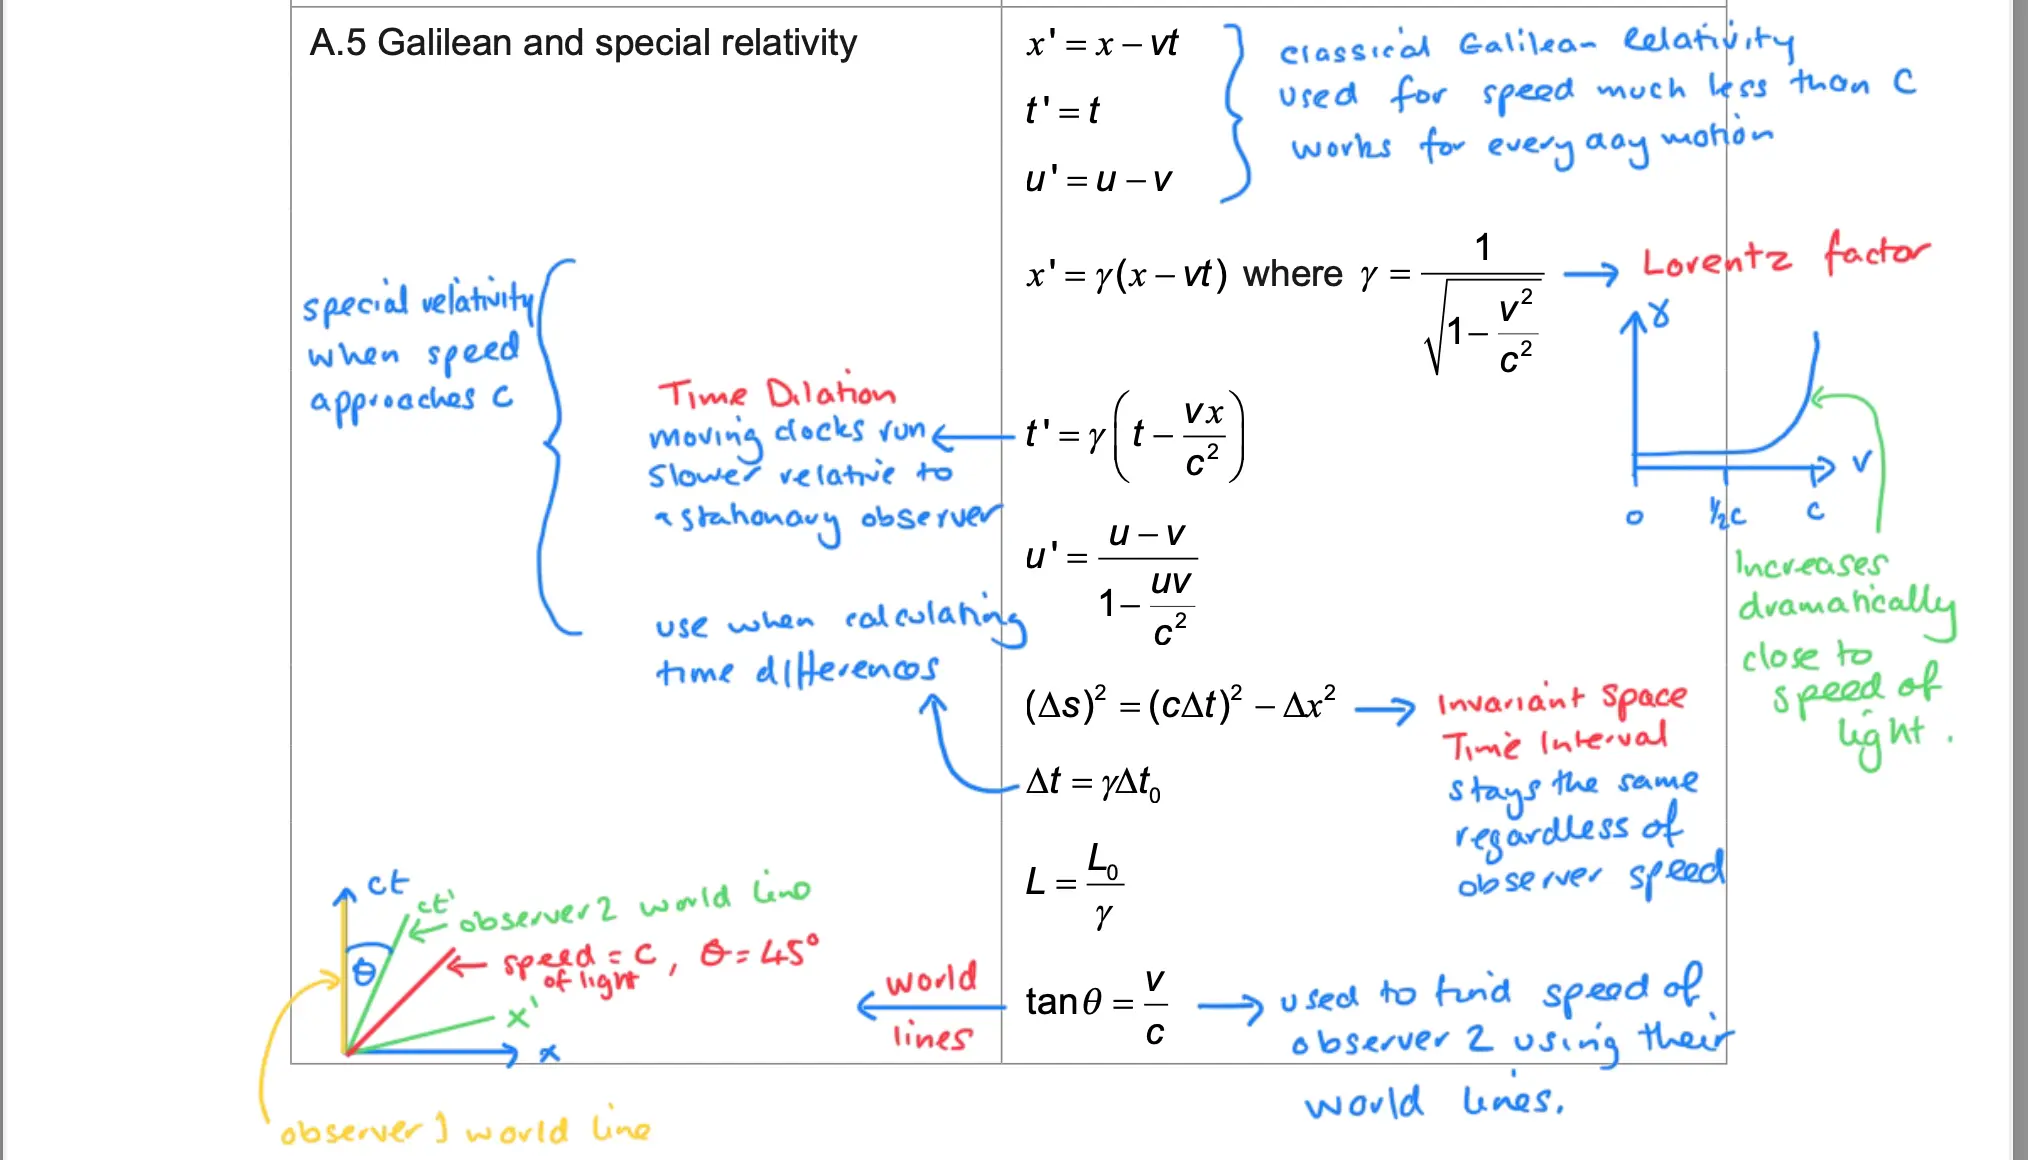
Add a graph of the Lorentz factor against speed and a simple world line diagram. These are HL content and the kind of visual that examiners expect you to be able to interpret.
Thermal Energy Transfer
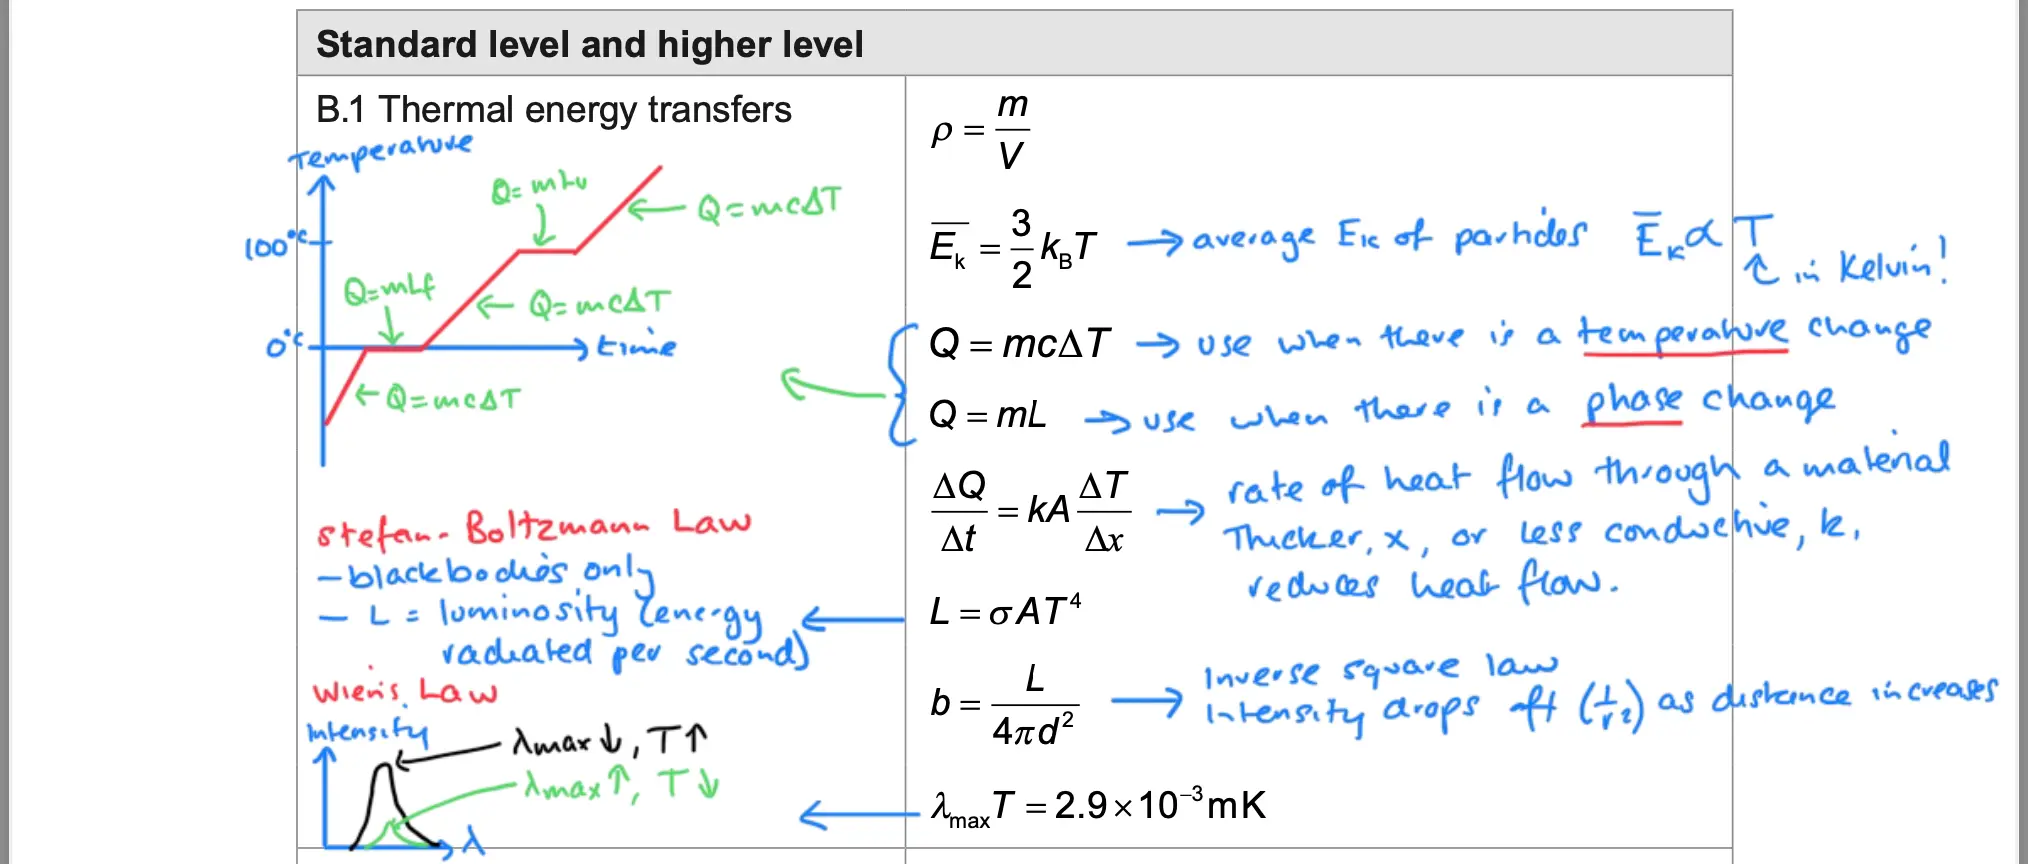
Adding a temperature-time graph showing phase changes (where you use Q = mcΔT versus Q = mL) is one of the most useful annotations in the whole booklet. Examiners love this topic.
Tip 5: Add Clarifications
Sometimes you just need a reminder of when to use which formula. I always used to mix up the equations for single slit diffraction and diffraction gratings. Simply labelling which formula goes with which scenario takes seconds and removes the confusion entirely.

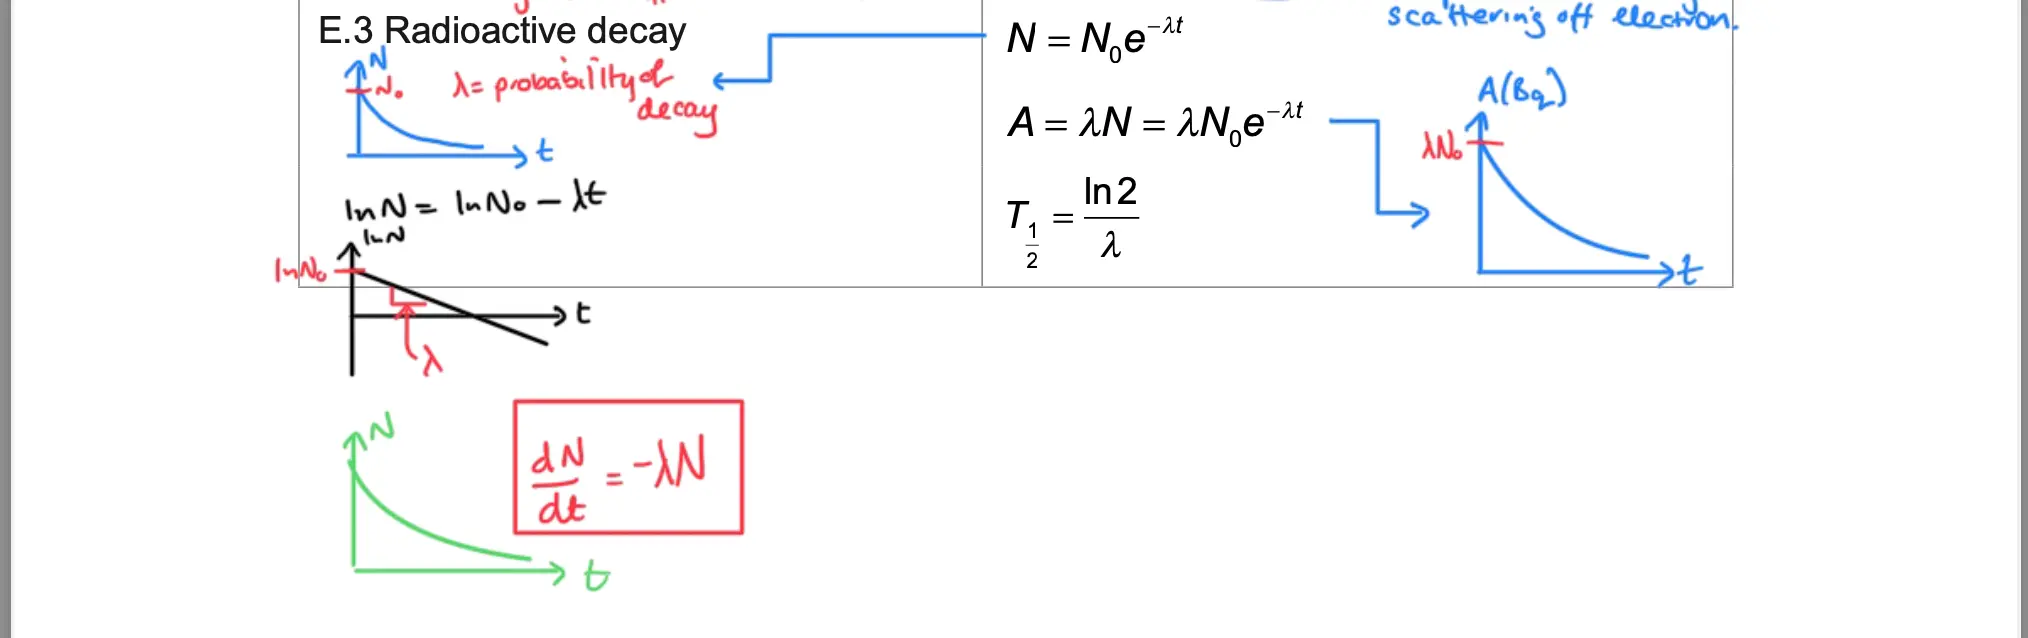
Tip 6: Annotate Exponential Relationships
Exponential relationships come up consistently, especially in Paper 1B where graph-based questions test your analytical skills. You will likely be asked to recognise exponential curves, determine half-lives, or linearise data by taking natural logs to turn a curve into a straight line.
Adding the linearised version of an exponential relationship to your booklet means you walk into the exam already knowing what to do when you see one. The clearest example is Topic E.3: Radioactive Decay.
Is It Worth Spending Two Hours on This?
One word: yes.
You will get a clean copy of the data booklet in your exam. Your annotated copy is a study tool, not something you take in with you. But the process of annotating forces you to engage with every section of the syllabus in a meaningful, active way. By the time you finish, you will have effectively reviewed the majority of IB Physics.
If you are looking for a structured starting point, the GradePod Exam Pack includes my fully annotated version of the data booklet: diagrams added to every section, missing formulas inserted, key constants highlighted, and exam-specific notes throughout. It is included alongside the topic-by-topic past paper questions, knowledge questions, mock exam, and revision note templates.
Get the GradePod Exam Pack for £39 →
Sally Weatherly is a Fellow of the Institute of Physics, author of 4 IB Physics books (two hit #1 on Amazon), and has been teaching IB Physics since 2004. GradePod has helped 30,000+ students since 2020.